Debugging the Model Context Protocol (MCP) with tcpdump
Over the last few months I’ve been researching MCP from a few different angles to understand the best way to use it in an application ecosystem, and also how to build for it at scale. Part of this research has been a deep-dive into the protocol itself, and how clients and servers communicate.
When conducting this type of research, I always start with the documentation. But, sooner or later I need to actually see how it works to really understand what I’m dealing with. Since remote MCP servers communicate over a network–over HTTP specifically–it’s possible to inspect their traffic using standard network debugging tools.
In this post, I’m going to provide an example of a simple MCP server, and then demonstrate how I’ve been understanding the client/server communication by inspecting their traffic using tcpdump.
Let’s start with an MCP server
The following Go program implements a basic MCP server, using the streamable HTTP transport:
package main

import (
        "context"
        "net/http"

        "github.com/modelcontextprotocol/go-sdk/mcp"
)

type fooInput struct {
        Bar string `json:"bar"`
}

type fooOutput struct {
        Bar string `json:"bar"`
}

func fooHandler(_ context.Context, req *mcp.CallToolRequest, input fooInput) (*mcp.CallToolResult, fooOutput, error) {
        output := fooOutput{Bar: input.Bar}
        return &mcp.CallToolResult{StructuredContent: output}, output, nil
}

func main() {
        mcpServer := mcp.NewServer(&mcp.Implementation{Name: "test", Version: "1"}, nil)

        mcp.AddTool(
                mcpServer,
                &mcp.Tool{
                        Name:        "foo",
                        Description: "Does the 'foo' action when a user asks for it",
                },
                fooHandler,
        )

        handler := mcp.NewStreamableHTTPHandler(
                func(*http.Request) *mcp.Server { return mcpServer },
                &mcp.StreamableHTTPOptions{
                        Stateless: true,
                },
        )

        http.ListenAndServe(":8080", handler)
}
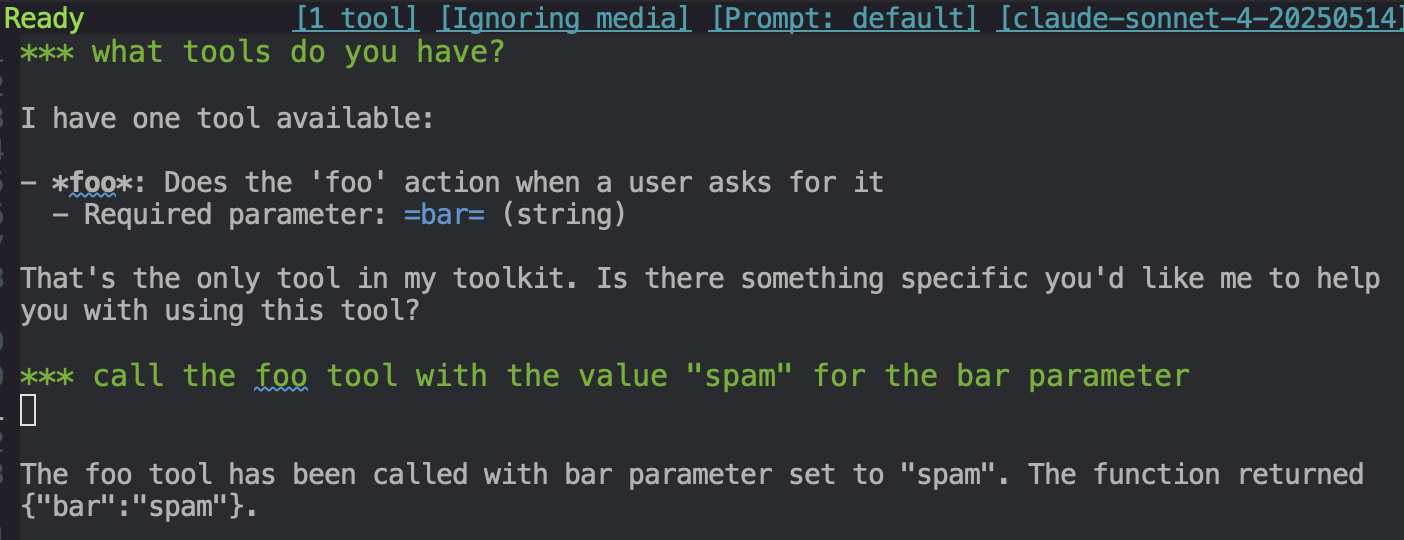
When you run this program with go run main.go, you can connect your local LLM to the MCP server at http://localhost:8080. Then, if you try using the foo tool, your server will be called:

What’s happening behind the scenes?
If we want to inspect the network traffic between the LLM’s MCP client and the server–the raw MCP messages–we can do so using tcpdump:
$ tcpdump -i any -A -q port 8080
These command line options will inspect the local traffic to and from port 8080, printing out the most useful parts of the network packets as plain text. The command line options I’ve used are as follows:
-i anyindicates that we want to capture TCP traffic on all network interfaces-Atellstcpdumpto output packets in ASCII-qreduces the amount of protocol-level information displayedport 8080is an expression that selects which packets to output; in this case all TCP traffic over port8080
If you run tcpdump, and then try using the MCP server again, you’ll see some output like this:
08:07:12.474591 IP localhost.55877 > localhost.http-alt: tcp 418
E.....@[email protected]...........
.l..uM.pPOST / HTTP/1.1
MIME-Version: 1.0
Connection: keep-alive
Host: localhost:8080
Accept-encoding: gzip
Accept: text/event-stream, application/json
User-Agent: URL/Emacs Emacs/30.1 (OpenStep; aarch64-apple-darwin24.1.0)
Content-Type: application/json
Mcp-Session-Id: Z32MC4SECO53HIEL3DCLROZXC7
Content-length: 97

{"jsonrpc":"2.0","id":6,"method":"tools/call","params":{"name":"foo","arguments":{"bar":"spam"}}}

08:07:12.475024 IP localhost.http-alt > localhost.55877: tcp 335
E.....@[email protected].....
uO...l..HTTP/1.1 200 OK
Cache-Control: no-cache, no-transform
Connection: keep-alive
Content-Type: text/event-stream
Date: Fri, 28 Nov 2025 08:07:12 GMT
Transfer-Encoding: chunked

95
event: message
data: {"jsonrpc":"2.0","id":6,"result":{"content":[{"type":"text","text":"{\"bar\":\"spam\"}"}],"structuredContent":{"bar":"spam"}}}
By tracing the actual network traffic between the MCP client and the server, you can now clearly see the JSON-RPC messages being exchanged. If there was a problem between client and server, this would be a great way to inspect what information is actually being exchanged.
In my case, however, it’s just a great way to see what’s happening behind the scenes, and gain a deeper understanding of the protocol in practice.